In 2021, the annual power generation will be 8,534.25 billion kWh, a year-on-year increase of 9.7%; thermal power generation will be 5,805.87 billion kWh, a year-on-year increase of 8.9%; hydropower generation will be 1,339 billion kWh, a year-on-year decrease of 1.2%; nuclear power generation will be 407.52 billion kWh , an increase of 11.3% year-on-year. In 2021, my country will add 146 new energy storage projects. Among them, there are 5 pumped storage projects and 131 electrochemical energy storage projects. Among electrochemical energy storage projects, there are as many as 120 lithium-ion battery energy storage projects.
China Energy Big Data Report (2022)
Chapter 1 Overview of Energy Development
Author of this chapter Cui Xiaoli
1. Macroeconomic situation
1
The national economy will continue to recover in 2021, with an average GDP growth of 5.1% in two years
In 2021, in the face of the complex and severe international environment and the multiple challenges of the domestic epidemic, my country’s national economy will continue to recover and develop, reform, opening up and innovation will be further advanced, people’s livelihood will be effectively guaranteed, new steps will be taken in building a new development pattern, and new high-quality development will be achieved. Achieved a good start in the “14th Five-Year Plan”.
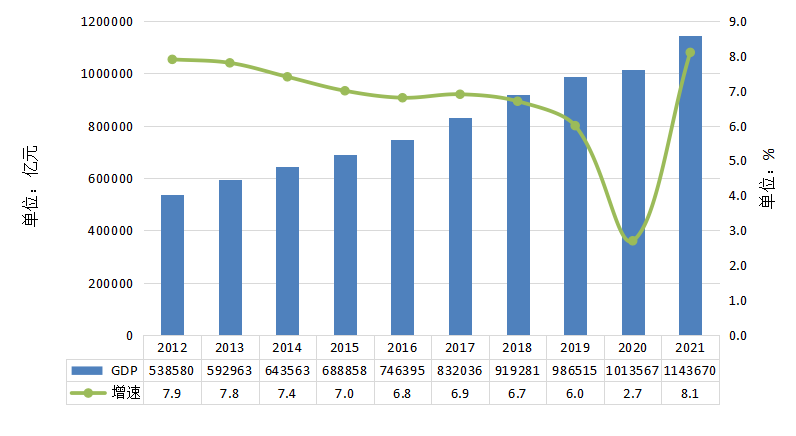
According to preliminary calculations by the National Bureau of Statistics, the GDP in 2021 will be 114.367 trillion yuan, an increase of 8.1% over the previous year, higher than the expected target of more than 6%, and an average growth of 5.1% in the two years. In the whole year, final consumption expenditure drove GDP growth by 5.3 percentage points, gross capital formation drove GDP growth by 1.1 percentage points, and net exports of goods and services drove GDP growth by 1.7 percentage points. The annual per capita GDP was 80,976 yuan, an increase of 8.0% over the previous year.
(Data source: National Bureau of Statistics)
Figure 1-1 2012-2021 GDP and Growth Rate
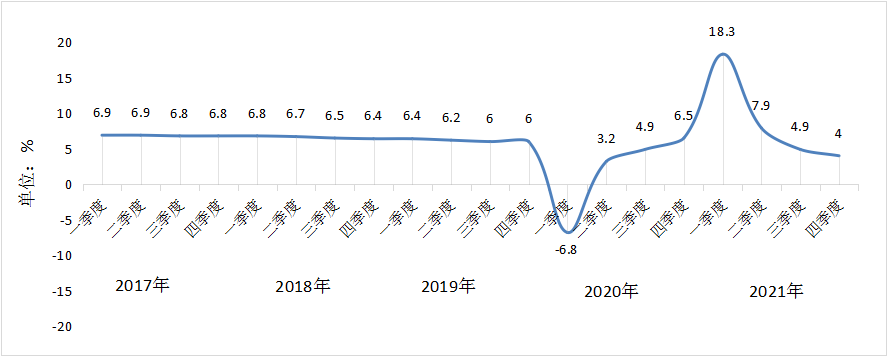
In terms of quarters, the GDP in the first quarter of 2021 increased by 18.3% year-on-year, the second quarter increased by 7.9%, the third quarter increased by 4.9%, and the fourth quarter increased by 4.0%. According to the average of two years, the growth rate was 4.9%, 5.5%, 4.9% and 5.2% respectively, and the economic operation was generally stable. In general, the quarterly growth rate in 2021 is directly related to the base affected by the epidemic in the previous year, but due to factors such as floods in Henan and Shaanxi and the epidemic in Nanjing, the growth rate began to slow down significantly in the third quarter.
(Data source: National Bureau of Statistics)
Figure 1-2 GDP growth rate in each quarter of 2017-2021
(Data source: National Bureau of Statistics)
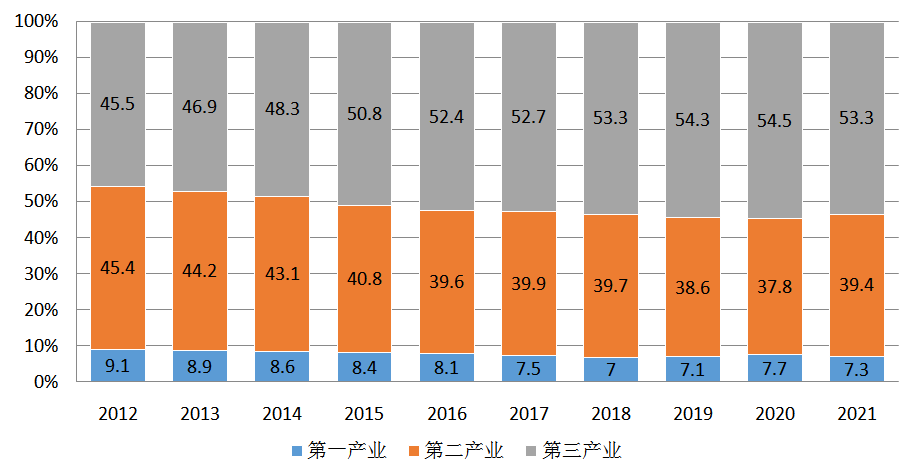
Figure 1-3 The proportion of the added value of the three industries in GDP from 2012 to 2021
2
The level of industrial development has been improved, and the growth of new industries, new formats and new models has accelerated
In 2021, the added value of the primary industry will be 8308.6 billion yuan, an increase of 7.1% over the previous year; the added value of the secondary industry will be 45090.4 billion yuan, an increase of 8.2%; the added value of the tertiary industry will be 60968 billion yuan, an increase of 8.2%.
In terms of proportion, in 2021, the added value of the primary industry will account for 7.3% of the GDP, the added value of the secondary industry will account for 39.4%, and the added value of the tertiary industry will account for 53.3%. Under the influence of the epidemic, the proportion of the added value of the tertiary industry has dropped slightly, which is the same as that in 2018. This is the first time that the added value of the tertiary industry has dropped in recent years.
The growth of new industries, new formats and new models is accelerating. Among the industries above designated size, the added value of high-tech manufacturing industry increased by 18.2% over the previous year, accounting for 15.1% of the added value of industries above designated size; the added value of equipment manufacturing industry increased by 12.9%, accounting for 15.1% of the added value of industries above designated size. 32.4%. In the service industry above designated size, the operating income of strategic emerging service industry enterprises increased by 16.0% over the previous year. The annual investment in high-tech industries increased by 17.1% over the previous year. The annual output of new energy vehicles was 3.677 million, an increase of 152.5% over the previous year; the output of integrated circuits was 359.43 billion, an increase of 37.5%.
In 2021, the national industrial enterprises above designated size will realize a total profit of 8,709.2 billion yuan, an increase of 34.3% over the previous year, an increase of 39.8% over 2019, and an average increase of 18.2% over the two years. In terms of categories, the profit of the mining industry was 1,039.1 billion yuan, an increase of 190.7% over the previous year; the profit of the manufacturing industry was 7,361.2 billion yuan, an increase of 31.6%; and the production and supply of electricity, heat, gas and water was 308.9 billion yuan, a decrease of 41.9%.
3
Fixed asset investment grew steadily, and manufacturing investment increased by 13.5%
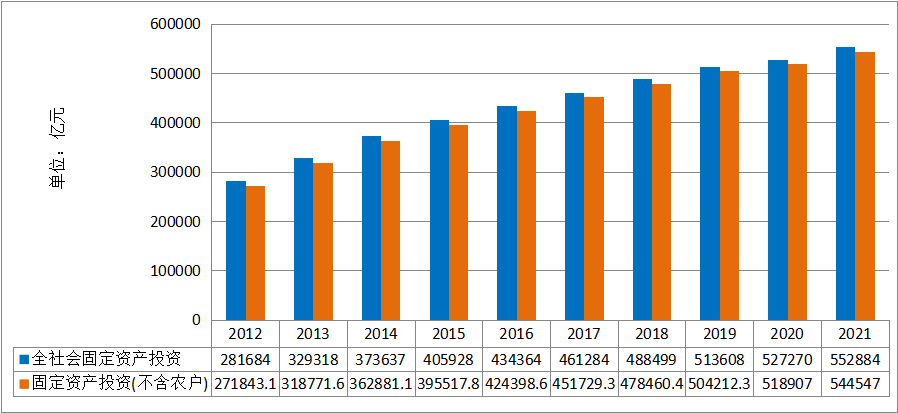
In 2021, the whole society will invest 55,288.4 billion yuan in fixed assets, an increase of 4.9% over the previous year. Fixed asset investment (excluding farmers) was 54,454.7 billion yuan, an increase of 4.9%. In fixed asset investment (excluding farmers), in terms of different regions, the investment in the eastern region increased by 6.4%, the investment in the central region increased by 10.2%, the investment in the western region increased by 3.9%, and the investment in the northeast region increased by 5.7%.
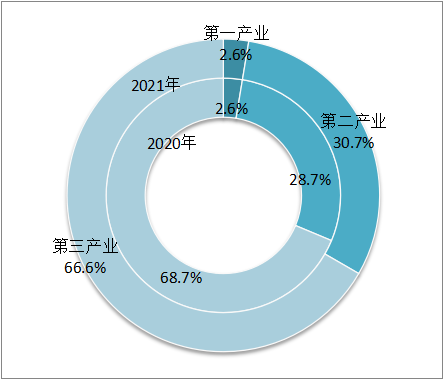
In fixed asset investment (excluding farmers), the investment in the primary industry was 1427.5 billion yuan, an increase of 9.1% over the previous year; the investment in the secondary industry was 16,739.5 billion yuan, an increase of 11.3%; the investment in the tertiary industry was 36,287.7 billion yuan, an increase of 2.1%. Private investment in fixed assets was 30,765.9 billion yuan, an increase of 7.0%. Infrastructure investment rose 0.4%, and manufacturing investment rose 13.5%. Investment in the social sector increased by 10.7%.
Compared with the proportion of investment in the three industries in recent years, the investment in the secondary industry has changed and continued to shrink, and the proportion will rise by 2 percentage points in 2021.
(Data source: National Bureau of Statistics)
Figure 1-4 2012-2021 Fixed Asset Investment of the Whole Society
(Data source: National Bureau of Statistics)
Figure 1-5 Proportion of investment in three industries in fixed asset investment (excluding farmers) in 2020 and 2021
2. Energy production and supply
1
Steady growth in energy production and further enhancement of safe supply capabilities
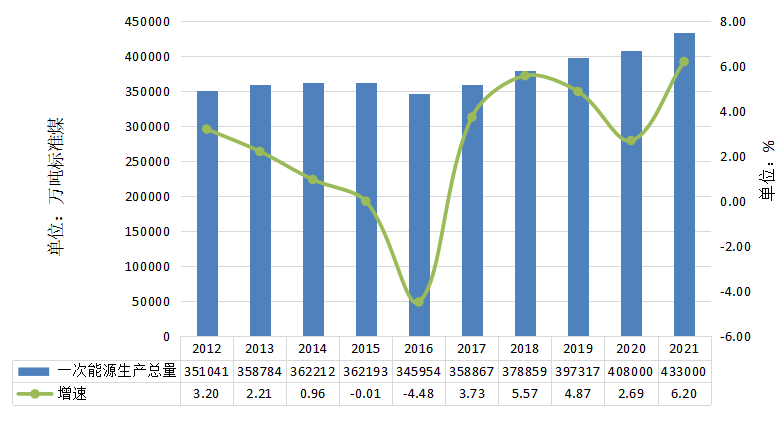
In 2021, with the continuous advancement of the policy of increasing production and ensuring supply, energy production will grow steadily, and the capacity for safe supply will be further enhanced. In 2021, the growth rate of raw coal, crude oil, and electricity production will be faster than the previous year, while the growth rate of natural gas production will slow down.
2021 Energy Production
The total production of primary energy was 4.33 billion tons of standard coal, a year-on-year increase of 6.2%.
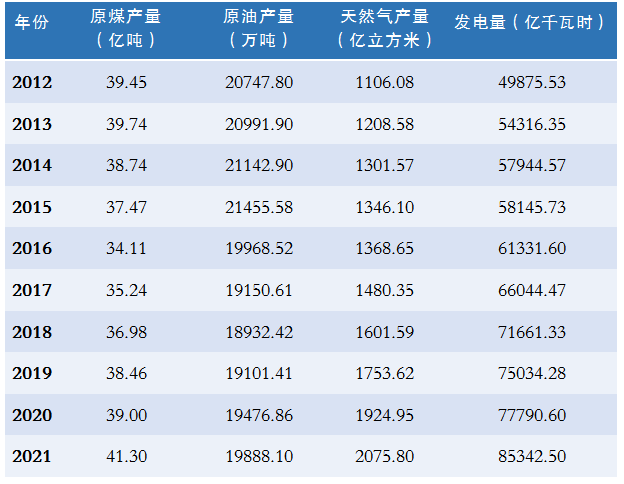
The output of raw coal was 4.13 billion tons, a year-on-year increase of 5.7%.
The output of crude oil was 198.881 million tons, a year-on-year increase of 2.1%.
The output of natural gas was 207.58 billion cubic meters, a year-on-year increase of 7.8%.
The power generation was 8,534.25 billion kWh, a year-on-year increase of 9.7%.
Note: The growth rate in 2020 and before is calculated
(Data source: National Bureau of Statistics)
Figure 1-6 Total energy production and growth rate from 2012 to 2021
raw coal
In 2021, in the face of tight coal supply and sharp price increases, coal production enterprises will make every effort to increase production and supply, and accelerate the release of high-quality production capacity. The annual output of raw coal is 4.13 billion tons, an increase of 5.7% over the previous year, effectively ensuring the safety and warmth of the people. winter and the economy is running smoothly.
oil and gas
In 2021, oil and gas production enterprises will continue to increase their exploration and development efforts, promote the increase of reserves and production, and strive to ensure the oil and gas for the economy and people’s livelihood. The annual crude oil output was 198.881 million tons, an increase of 2.1% over the previous year, and the growth rate was 0.5 percentage points higher than the previous year. It stabilized and rebounded for three consecutive years; the crude oil processing output was 703.554 million tons, a new high, a year-on-year increase of 4.3%, compared with 2019. An increase of 7.4%, with a two-year average growth of 3.6%. The annual output of natural gas was 207.58 billion cubic meters, an increase of 7.8% over the previous year. The output of natural gas exceeded 200 billion cubic meters for the first time, and it also increased by more than 10 billion cubic meters for five consecutive years.
electricity
Power production enterprises adhere to the priority of people’s livelihood, strive to improve the level of power supply, and make every effort to ensure the electricity demand for economic and people’s livelihood. The annual power generation was 8,534.25 billion kWh, a year-on-year increase of 9.7%; thermal power generation was 5,805.87 billion kWh, a year-on-year increase of 8.9%; hydropower generation was 1,339 billion kWh, a year-on-year decrease of 1.2%; nuclear power generation was 407.52 billion kWh, a year-on-year increase 11.3%.
Table 1-1 Total production of major energy varieties from 2012 to 2021
(Data source: National Bureau of Statistics)
2
Continuous optimization of energy production structure
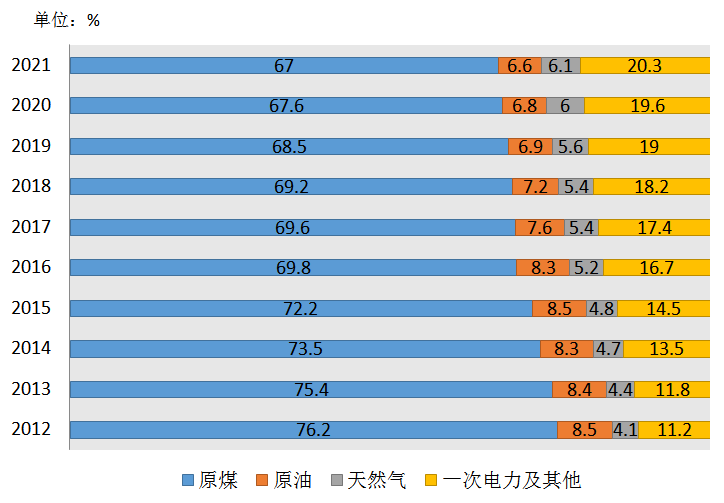
In 2021, my country’s clean energy will continue to develop rapidly, the proportion will be further increased, and the energy structure will continue to be optimized. In a relatively long period of time, although the proportion of coal will gradually decrease, it is difficult to change the status of coal as the main energy source in the short term.
(Data source: National Bureau of Statistics)
Figure 1-7 Energy production structure from 2012 to 2021
In the past ten years, the proportion of different types of energy has shown different trends. The proportion of raw coal production continues to decline, with a decrease of 8.6 percentage points in 2021 compared with 2012. The proportion of total crude oil production continued to decline, with a decrease of 1.9 percentage points in 2021 compared with 2012. The proportion of natural gas production has increased slightly, increasing by 2 percentage points in 2021 compared with 2012, and the proportion of primary power production such as hydropower, nuclear power, and wind power has increased significantly, and in 2021, it has increased by 8.5 percentage points compared with 2012.
The development of non-fossil energy has reached a new level. In 2021, my country’s non-fossil energy power generation installed capacity will historically exceed 1 billion kilowatts, reaching 1,117.2 million kilowatts, a year-on-year increase of 13.4%, accounting for about 47% of the total power generation installed capacity, an increase of 2.3 percentage points over the previous year, surpassing coal for the first time in history. The proportion of electrical installations. The non-fossil energy power generation was 2.9 trillion kWh, a year-on-year increase of 12.0%, accounting for 34.6% of the total power generation. The installed capacity of wind power, photovoltaic power generation, hydropower and biomass power generation has ranked first in the world for many consecutive years. The consumption of clean energy continues to improve. In 2021, the average utilization rates of hydropower, wind power and photovoltaic power generation will reach about 98%, 97% and 98% respectively.
3
Energy imports rise and fall
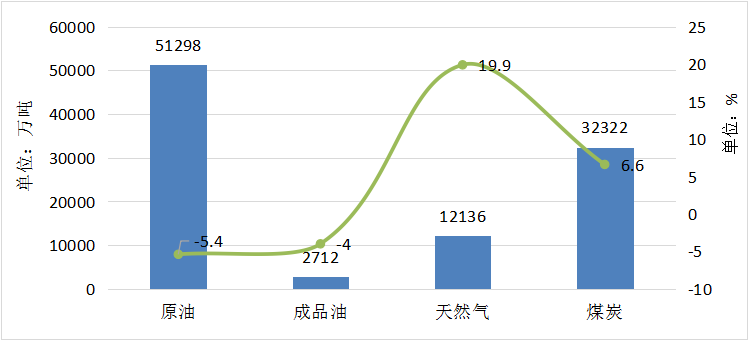
In 2021, the import volume of my country’s energy products will rise and fall. The import volume of crude oil will decrease by 5.4% year-on-year, the import volume of natural gas will increase by 19.9% year-on-year, and the import volume of coal and lignite will increase by 6.6% year-on-year.
(Data source: General Administration of Customs)
Figure 1-8 Energy import volume and growth rate in 2021
Since 2021, international oil prices have risen sharply, and the import cost of crude oil has risen sharply, suppressing some import demand. Domestic natural gas demand has grown strongly, while domestic natural gas production growth has not been as fast as consumption growth, and both pipeline gas and LNG imports have achieved double growth. The supply and demand relationship in the domestic coal market is tense, the price of domestic trade coal continues to rise, and the price of foreign coal has obvious advantages. Enterprises are more willing to purchase imported coal, and the coal import volume has increased year-on-year.
Crude oil and refined oil imports in 2021
Crude oil imports were 512.98 million tons, a year-on-year decrease of 5.4%, and the value was 1,661.8 billion yuan, a year-on-year increase of 34.4%.
The import of refined oil was 27.12 million tons, a year-on-year decrease of 4.0%, and the value was 107.8 billion yuan, a year-on-year increase of 31.6%.
Natural gas imports in 2021
The import of natural gas was 121.36 million tons (about 167.5 billion cubic meters), a year-on-year increase of 19.9%, and the value was 360.1 billion yuan, a year-on-year increase of 56.3%.
Coal imports in 2021
Imported coal and lignite reached 323.22 million tons, a year-on-year increase of 6.6%, and the value was 231.9 billion yuan, a year-on-year increase of 64.1%.
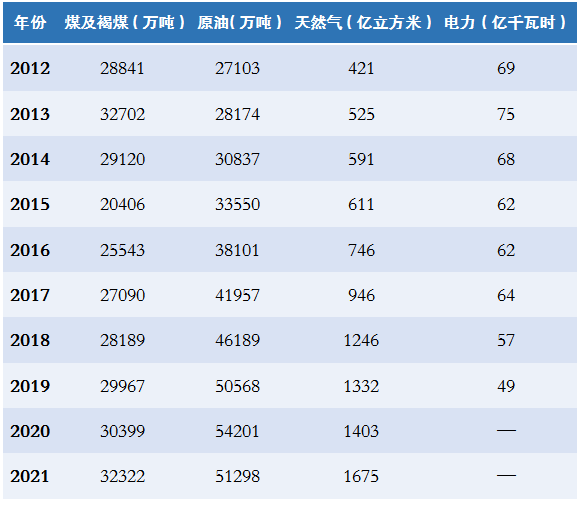
Table 1-2 my country’s energy imports from 2012 to 2021
(Data sources: National Bureau of Statistics, General Administration of Customs)
Since the 18th National Congress of the Communist Party of China, the construction of energy and livelihood projects has continued to increase, and the electricity consumption problem of people without electricity has been solved historically. The photovoltaic poverty alleviation project has benefited 4.15 million poor households. Leading the way, built the world’s largest electric vehicle charging network, withstood the severe test of the new crown pneumonia epidemic, earthquakes, extreme weather and other natural disasters, and effectively guaranteed the continuous improvement of people’s livelihood and well-being with clean, low-carbon, safe and efficient energy supply, and helped alleviate poverty. Tackling fortifications, rural revitalization and building a beautiful China have played an important role.
3. Energy consumption
1
Energy consumption demand gradually recovers
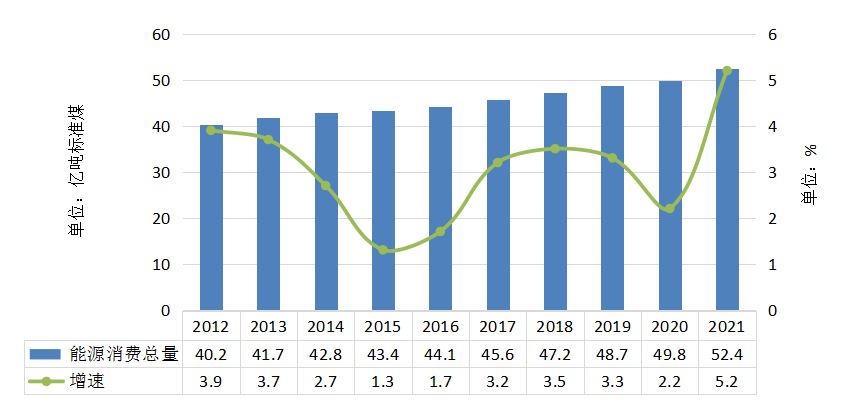
In 2021, as my country’s economic and social order continues to recover steadily, the domestic economic recovery and the growth of export orders far exceed expectations, and energy demand is also gradually picking up. The total energy consumption in the whole year was 5.24 billion tons of standard coal, an increase of 5.2% over the previous year, and an average increase of 3.7% in the two years. Coal consumption increased by 4.6%, crude oil consumption increased by 4.1%, and natural gas consumption increased by 12.5%. In 2021, due to factors such as dual control of energy consumption, the policy of resolutely curbing the blind development of “two high” projects, and the rising base in the same period, the growth rate of energy consumption will decline quarter by quarter.
(Data source: National Bureau of Statistics)
Figure 1-9 Total energy consumption and growth rate from 2012 to 2021
Since 2012, the total energy consumption has been growing at a low rate, supporting the medium-to-high-speed development of the economy with a low growth rate of energy consumption.
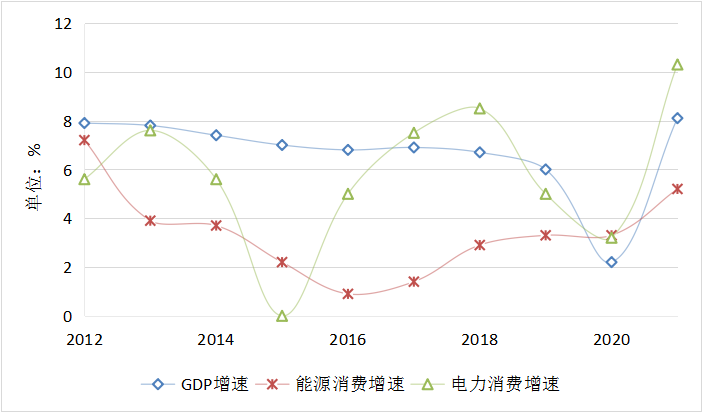
In 2021, electricity consumption growth will be the highest since 2012. The electricity consumption of the whole society increased by 10.3% year-on-year, reaching 8.3 trillion kWh; In 2021, the electricity consumption of the whole society will increase by 7.1% on average for two years.
The growth rate of electricity consumption continues to be higher than that of energy consumption, and the electrification process in my country continues to advance, and this trend is expected to continue in the future. Gross domestic product, energy consumption and electricity consumption have basically the same trend of change, and energy and electricity play an important supporting role in my country’s economic development.
(Data source: National Bureau of Statistics)
Figure 1-10 Comparison of GDP growth rate, energy consumption growth rate, and electricity consumption growth rate from 2012 to 2021
Table 1-3 Consumption of main energy varieties from 2012 to 2021 (unit: 10,000 tons of standard coal)
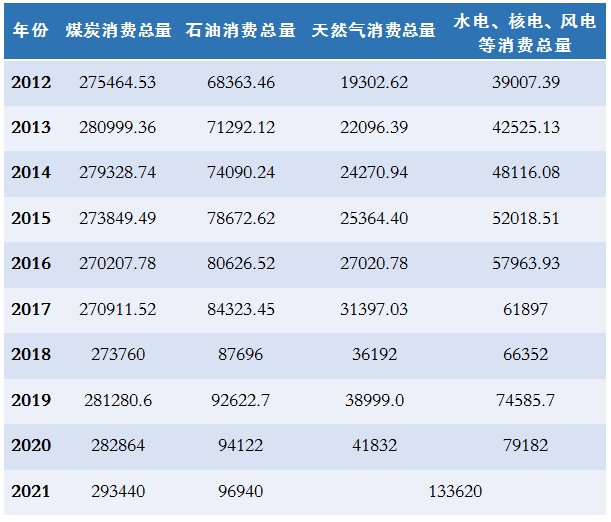
Note: Data for 2020 and 2021 are calculated
(Data source: National Bureau of Statistics)
2
The transformation of energy consumption structure to clean and low-carbon is accelerating
In 2021, coal consumption will account for 56.0% of total energy consumption, down 0.9 percentage points from the previous year. Natural gas, hydropower, nuclear power, wind power, solar power and other clean energy consumption accounted for 25.5% of the total energy consumption, an increase of 1.2 percentage points over the previous year and an increase of about 11 percentage points over 2012. The energy consumption structure is accelerating towards a clean and low-carbon change.
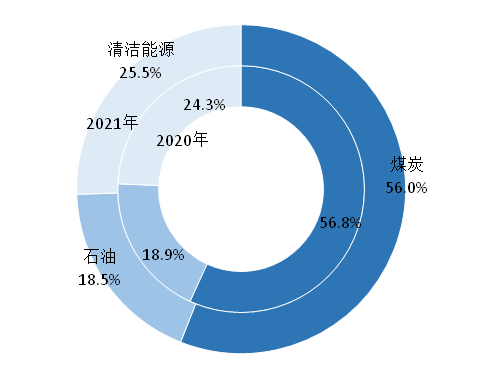
(Data source: National Bureau of Statistics)
Figure 1-11 Energy consumption structure in 2020 and 2021
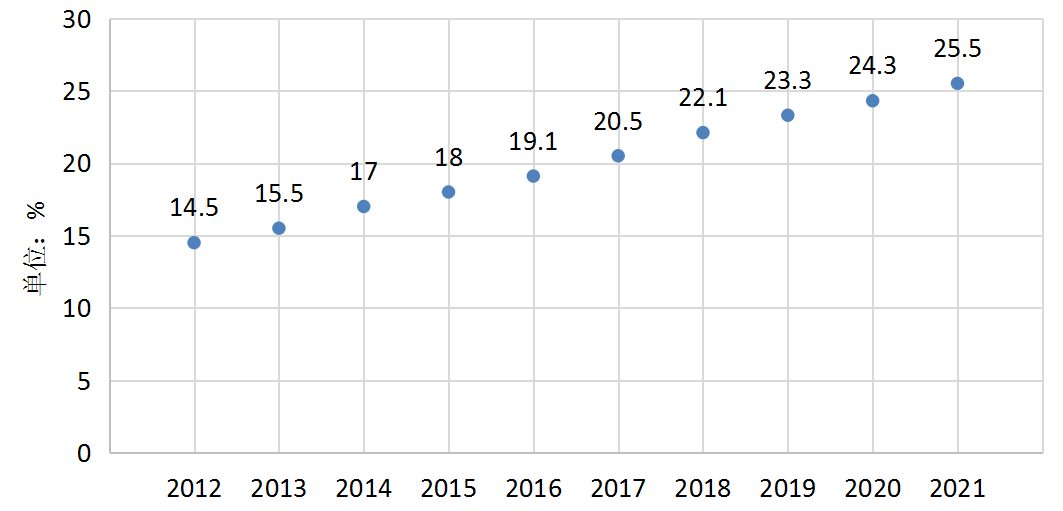
(Data source: National Bureau of Statistics)
Figure 1-12 Proportion of clean energy consumption to total energy consumption from 2012 to 2021
From the data of energy consumption structure in recent years, the proportion of coal consumption has shown a downward trend. In 2018, it fell below 60%, and the proportion continued to decline. The proportion of clean energy consumption in total energy consumption has nearly doubled from 14.5% in 2012 to 25.5% in 2022. Overall, in my country’s energy composition, coal is in the dominant position, oil and natural gas are highly dependent on foreign countries, and the proportion of clean energy consumption continues to increase.
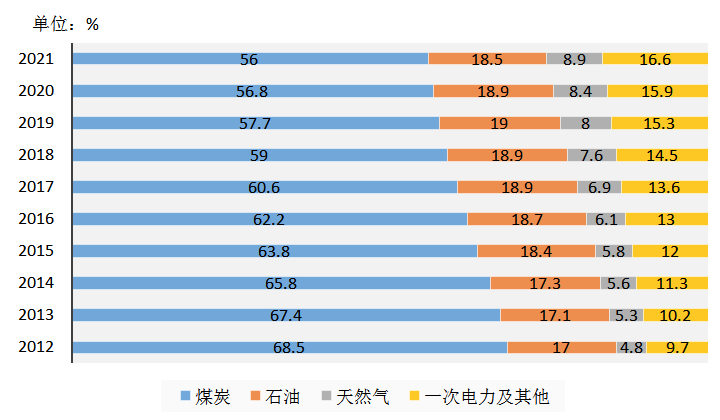
(Data source: National Bureau of Statistics)
Figure 1-13 2012-2021 Energy Consumption Structure
The clean heating area in the northern region is about 15.6 billion square meters, and the clean heating rate reaches 73.6%, replacing more than 150 million tons of loose coal (including coal used in low-efficiency small boilers). The friendliness of energy and the ecological environment will be significantly improved, the formation of an energy-saving society will be accelerated, and the energy consumption structure will be more optimized.
4. Energy Investment
1
Domestic investment situation
In 2021, investment in my country’s mining industry will increase by 10.9% year-on-year, investment in manufacturing will increase by 13.5% year-on-year, and investment in electricity, heat, gas and water production and supply will increase by 1.1% year-on-year.
2021 Power Investments
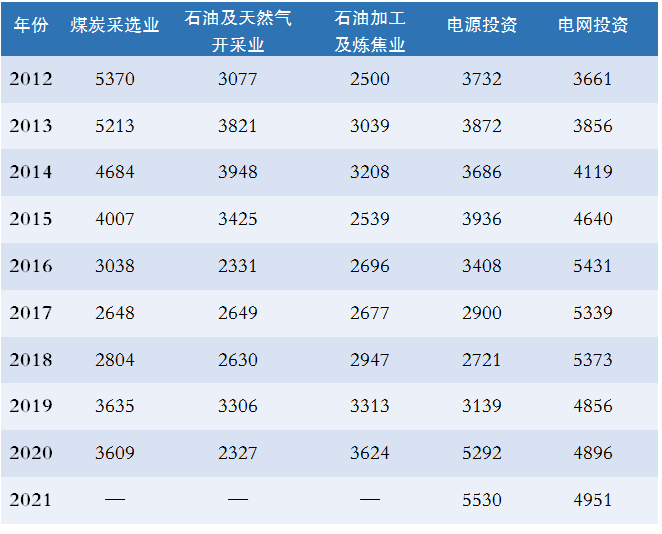
The investment in power infrastructure construction was 553 billion yuan, a year-on-year increase of 4.5%. The investment in hydropower was 98.8 billion yuan, a year-on-year decrease of 7.4%. The thermal power investment was 67.2 billion yuan, a year-on-year increase of 18.3%.
Nuclear power investment was 53.8 billion yuan, a year-on-year increase of 41.8%.
Grid investment in 2021
The investment in the capital construction of the power grid was 495.1 billion yuan, a year-on-year increase of 1.1%. The newly added capacity of 220kV and above substation equipment was 243.34 million kVA, a year-on-year increase of 9.2%.
The newly added 220 kV and above transmission line loop length is 32,220 kilometers, a year-on-year decrease of 8.0%.
Table 1-4 2012-2021 fixed asset investment in the energy industry (excluding farmers) (unit: 100 million yuan)
(Data source: National Bureau of Statistics)
2
Foreign investment
In 2021, the foreign non-financial direct investment will be 733.2 billion yuan, down 3.5% from the previous year, or 113.6 billion US dollars, up 3.2%. Among them, the non-financial direct investment in countries along the “Belt and Road” was 20.3 billion US dollars, an increase of 14.1%.
mining industry
The foreign non-financial direct investment amounted to US$4.98 billion, a year-on-year decrease of 2.2%.
manufacturing
Foreign non-financial direct investment was US$18.4 billion, a year-on-year decrease of 7.9%.
Electricity, heat, gas and water production and supply industry
The foreign non-financial direct investment amounted to 4.89 billion US dollars, a year-on-year increase of 75.9%.
The “Guiding Opinions on Energy Work in 2022” proposes to solidly promote practical cooperation in energy. On the premise of effectively preventing foreign investment risks, strengthen energy and resource cooperation with relevant countries. Vigorously support the green and low-carbon development of energy in developing countries. Consolidate and deepen cooperation and trade in the field of traditional energy, pragmatically promote overseas cooperation in the field of nuclear power, build and operate overseas energy cooperation projects, and deepen the interconnection of surrounding power. Strengthen exchanges and cooperation with other countries in green energy and smart energy. Build a number of green energy cooperation demonstration projects, so that green can become the background color of the joint construction of the “Belt and Road”.
5. Energy Efficiency
1
Energy efficiency continues to improve
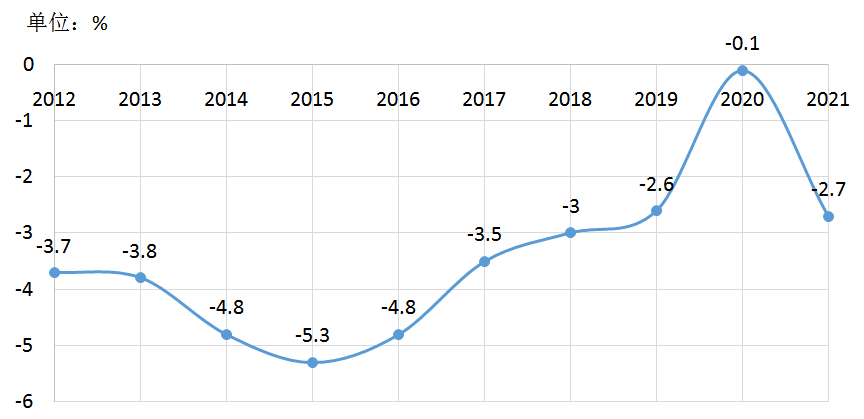
In 2021, the national energy consumption per 10,000 yuan of GDP will drop by 2.7% over the previous year. Since the 18th National Congress of the Communist Party of China, my country has continuously promoted the revolution of energy production, accelerated the process of clean and low-carbonization, optimized the energy structure, and improved the efficiency of energy utilization. The economic structure has been continuously optimized and upgraded, the economy has shifted from factor-driven and investment-driven to innovation-driven, and the mode of economic development is changing from extensive growth based on scale and speed to intensive growth based on quality and efficiency.
In 2021, the comprehensive energy consumption per unit of calcium carbide of key energy-consuming industrial enterprises will decrease by 5.3%, the comprehensive energy consumption per unit of synthetic ammonia will remain the same as the previous year, the comprehensive energy consumption per ton of steel will decrease by 0.4%, and the comprehensive energy consumption per unit of electrolytic aluminum will decrease by 2.1%. Standard coal consumption for power generation decreased by 0.5%.
(Data source: National Bureau of Statistics)
Figure 1-14 Reduction rate of energy consumption per 10,000 yuan of GDP from 2012 to 2021
my country continues to promote energy-saving and consumption-reducing transformation of coal-fired power generating units. By the end of 2021, the average coal consumption of thermal power supply will drop to 302.5 grams of standard coal/kWh, a decrease of 6.9% compared with 2012; Eliminate outdated production capacity and accelerate the promotion of energy-saving technological equipment and electric energy substitution.
In 2021, the average utilization rates of hydropower, wind power and photovoltaic power generation will reach about 98%, 97% and 98% respectively, and the average annual utilization hours of nuclear power will exceed 7,700 hours.
2
10,000 yuan of GDP carbon dioxide emissions continue to decline
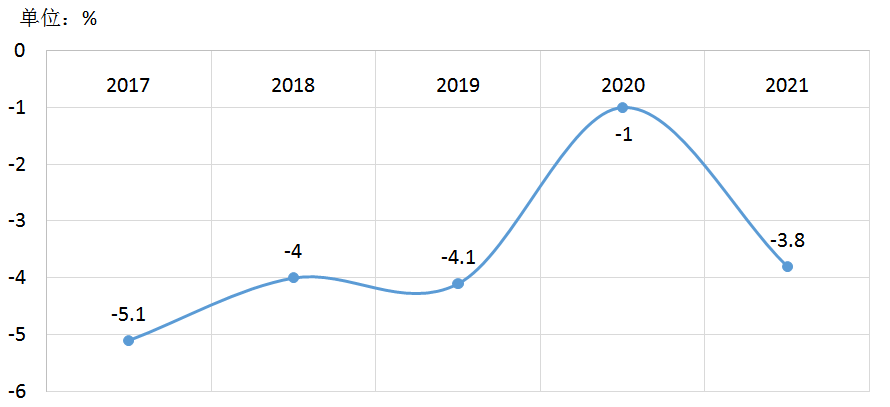
In 2021, carbon dioxide emissions per 10,000 yuan of GDP nationwide will drop by 3.8%. In recent years, all parts of the country have focused on the key task of air pollution prevention and control, and solidly promoted the substitution of coal reduction and electric energy to achieve clean and efficient use of energy. According to the “Carbon Peaking Action Plan before 2030”, by 2025, carbon dioxide emissions per unit of GDP will be reduced by 18% compared with 2020.
(Data source: National Bureau of Statistics)
Figure 1-15 Decrease of carbon dioxide emissions per 10,000 yuan of GDP in China from 2017 to 2021
3
The elasticity coefficient of energy consumption has decreased
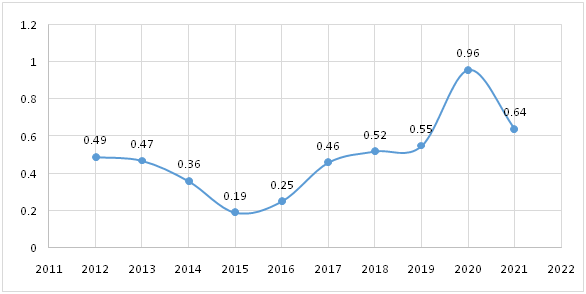
The elasticity coefficient of energy consumption refers to the ratio of the growth rate of energy consumption to the growth rate of GDP. According to estimates, the elastic coefficient of energy consumption in 2021 will be 0.64, and the elastic coefficient of electricity consumption will be 1.27.
Note: 2021 data is calculated
(Data source: National Bureau of Statistics)
Figure 1-16 Elasticity coefficient of energy consumption from 2012 to 2021
In terms of ten-year data, 0.19 in 2015 was the lowest point in the past ten years, and it has remained around 0.5 in recent years. In 2020, due to the severe impact of the epidemic on economic development, the growth rate of GDP dropped from 6% in 2019 to 2.3%, resulting in a significant increase in the elasticity of energy consumption. A pullback in 2021. If calculated based on the average growth rate of two years, the elastic coefficient of energy consumption is 0.73.
6. Operation of the carbon market
1
Positive results have been achieved in carbon market construction
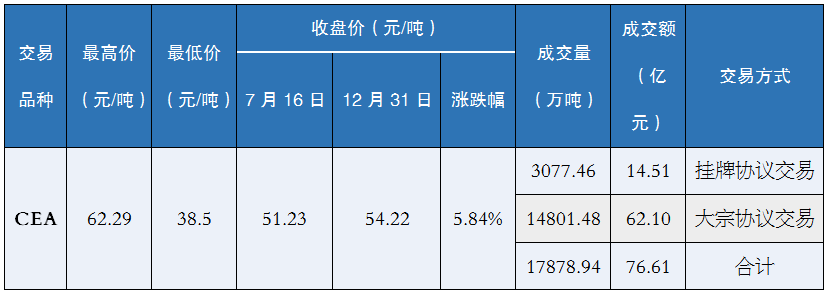
In 2021, the activity of the national carbon emissions trading market will increase significantly. On July 16, 2021, the national carbon market was officially launched, and the first compliance cycle ended on December 31, 2021, including 2,162 key emission units in the power generation industry, covering about 4.5 billion tons of carbon dioxide emissions, which is the largest in the world. carbon market.
Table 1-5 National carbon market transaction data in 2021
Source: Shanghai Environment and Energy Exchange)
Source: Shanghai Environment and Energy Exchange)
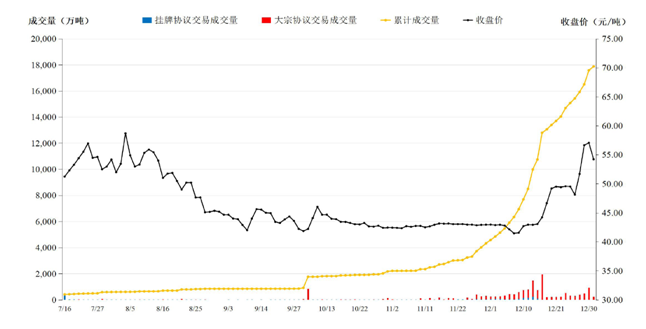
Figure 1-17 Cumulative trading volume and closing price of the national carbon market in 2021
Source: Shanghai Environment and Energy Exchange)
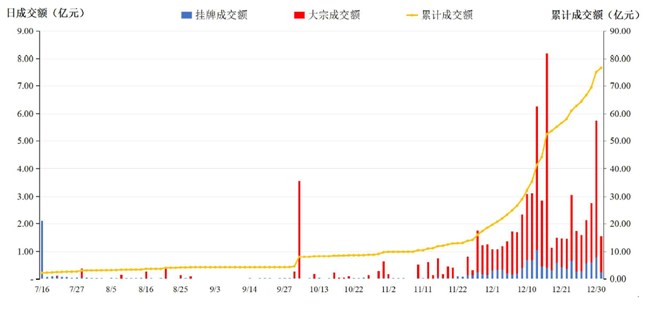
Figure 1-18 National carbon market turnover in 2021
Data shows that as of December 31, 2021, the national carbon emission trading market has operated for 114 trading days, with a cumulative trading volume of carbon emission allowances (CEA) of 179 million tons and a cumulative turnover of 7.661 billion yuan. The fulfillment completion rate during the cycle was 99.5%.
Among them, the cumulative transaction volume of listing agreement transactions was 30.7746 million tons, and the cumulative transaction value was 1.451 billion yuan; the cumulative transaction volume of block agreement transactions was 148.0148 million tons, and the cumulative transaction value was 6.210 billion yuan. The closing price on December 31 was 54.22 yuan/ton, up 12.96% from the opening price on the first day. The carbon market is operating in a healthy and orderly manner, with stable and rising transaction prices, and the role of promoting companies to reduce greenhouse gas emissions and accelerate green and low-carbon transformation has initially appeared.
2
The green certificate transaction rate has been greatly improved
The green certificate is an electronic certificate with a unique identification code issued by my country to power generation enterprises for each MWh of non-water renewable energy on-grid electricity.
In 2017, relying on the renewable energy power generation project information management system, my country issued a green power certificate on a trial basis for the renewable energy power generation produced by onshore wind power and photovoltaic power generation enterprises (excluding distributed photovoltaic power generation). In 2020, biomass power generation will be included in the green certificate trading scope.
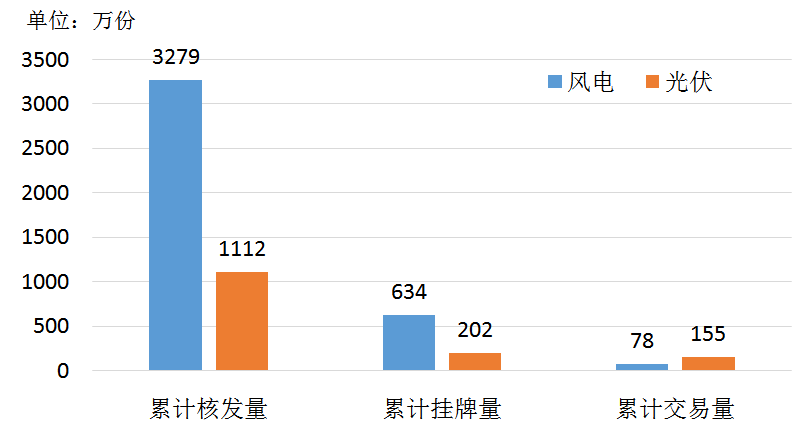
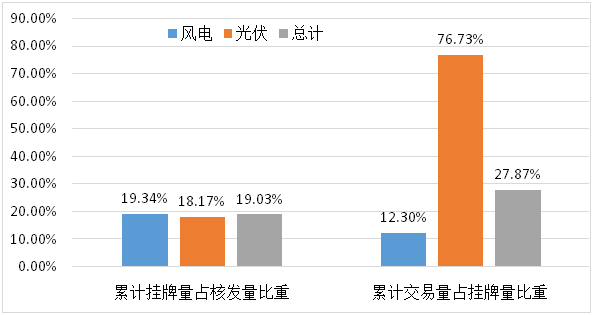
According to the data of the green certificate subscription platform, from the official launch in July 2017 to June 9, 2022, the cumulative issuance of wind power and photovoltaics were 32.79 million and 11.12 million, respectively, and the cumulative listings were 6.34 million and 202 million. 10,000 copies, and the cumulative transaction volume was 780,000 copies and 1.55 million copies respectively.
Judging from the listing rate, the proportion of green certificate listings is less than one-fifth of the issued amount. From the perspective of transaction rate, the ratio of photovoltaic transaction volume to listing volume is relatively high, reaching 76.73%. However, compared with the absolute value of issuance and listing, the transaction volume of wind power and photovoltaics is relatively small.
Note: Data as of June 9, 2022
(Source: Calculated according to the Green Certificate Subscription Platform)
Figure 1-19 The actual volume of green certificate transactions in my country
In April 2021, the National Development and Reform Commission and the National Energy Administration jointly issued the “Notice on Further Doing a Good Job in the Pilot Work of the Construction of Electricity Spot Markets”, which proposed to study the establishment of a green power trading market as soon as possible and promote green power trading. In August 2021, the “Green Power Trading Pilot Work Plan” proposed to issue green certificates to new energy power generation entities participating in green power transactions through special green power transactions, and to directly assign green attribute labels and equity certificates to green power products in the circulation link. , to achieve the synchronous circulation of green certificates and green electricity, so as to fully restore the commodity attributes of green electricity. In January 2022, the “Implementation Plan for Promoting Green Consumption” jointly issued by seven departments including the National Development and Reform Commission proposed to establish a mechanism for linking green power trading and renewable energy consumption responsibility weights, and market-oriented users can complete the process by purchasing green power or green certificates. Renewable energy consumption responsibility weight. In the same month, the “Guiding Opinions on Accelerating the Construction of a Unified National Electricity Market System” jointly issued by the National Development and Reform Commission and the National Energy Administration proposed to effectively connect green power trading with green certificate trading and carbon emission trading. Under the active promotion of a series of policies, the green certificate transaction rate has been greatly improved since 2021. According to the data of the Huajing Industry Research Institute, in January 2021, the wind power, photovoltaic and overall transaction rates were 1.30%, 0.03%, and 1.19%, respectively, while on June 9, 2022, these three figures increased to 12.30% and 76.73%, respectively. %, 27.87%.
Note: Data as of June 9, 2022
(Source: Calculated according to the Green Certificate Subscription Platform)
Figure 1-20 The proportion of actual completed green certificate transactions in my country
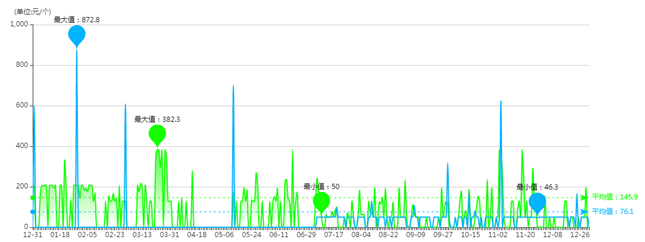
According to the data of the green certificate subscription trading platform, the average transaction prices of wind power green certificates and photovoltaic green certificates in my country in 2021 will be 145.9 yuan/piece and 76.1 yuan/piece respectively. Among them, the average transaction prices of wind power green certificates and photovoltaic green certificates for subsidized projects were 193.3 yuan per piece and 649.9 yuan per piece, respectively, and the average transaction prices of non-subsidized projects for wind power green certificates and photovoltaic green certificates were 50 yuan per piece and 50.2 yuan respectively. The price of green certificates for subsidized projects is much higher than that of non-subsidized projects.
Source: Green Certificate Subscription Platform)
Figure 1-21 The average daily transaction price of green certificate listing transactions in my country in 2021
7. Energy Policy
1
my country’s carbon peak carbon neutral “1+N” policy system core content released
On October 24, 2021, the Central Committee of the Communist Party of China and the State Council issued the “Opinions on Completely, Accurately and Comprehensively Implementing the New Development Concept and Doing a Good Job in Carbon Peaking and Carbon Neutralization”, and on October 26, the State Council issued the “Carbon Peaking Action Plan before 2030” . As the “1” in the carbon neutrality “1+N” policy system of Carbon Peak, the “Opinions” are the systematic planning and overall deployment of the carbon neutrality work by the Party Central Committee, and play a leading role in the policy system. The “Plan” is the policy document headed by “N”, and it is the overall deployment of the carbon peaking stage. The “Opinions” and “Plans” are the core content of my country’s “1+N” policy system for peak carbon neutralization.
2
Central Economic Work Conference: Correctly Understanding and Grasping Carbon Neutrality
On December 8, 2021, the Central Economic Work Conference emphasized that it is necessary to correctly understand and grasp the carbon neutrality of carbon peaking. Achieving carbon peaking and carbon neutrality is an inherent requirement to promote high-quality development. in a battle. It is necessary to adhere to the principles of national overall planning, conservation priority, two-wheel drive, smooth internal and external flow, and risk prevention. The gradual withdrawal of traditional energy should be based on the safe and reliable replacement of new energy. Based on the basic national conditions of coal as the mainstay, we must do a good job in the clean and efficient utilization of coal, increase the consumption capacity of new energy, and promote the optimal combination of coal and new energy. We must pay close attention to tackling key green and low-carbon technologies. It is necessary to conduct scientific assessment, new renewable energy and raw material energy consumption should not be included in the total energy consumption control, create conditions to realize the transition from “double control” of energy consumption to “double control” of total carbon emission and intensity as soon as possible, and accelerate the formation of pollution reduction and carbon reduction. The incentive and constraint mechanism to prevent simple layer-by-layer decomposition. To ensure energy supply, large enterprises, especially state-owned enterprises, should take the lead in ensuring supply and stable prices. It is necessary to further promote the energy revolution and accelerate the construction of an energy power.
3
“The Plan for Improving the Dual Control System of Energy Consumption Intensity and Total Volume” was issued
On September 11, 2021, the National Development and Reform Commission issued the “Plan for Improving the Dual Control System of Energy Consumption Intensity and Total Volume”, clarifying the overall arrangement, working principles and tasks and measures of my country’s dual control system for energy consumption during the “14th Five-Year Plan” period. The “Plan” proposes the overall goal that by 2025, the dual control system of energy consumption will be more complete, the allocation of energy resources will be more reasonable, and the utilization efficiency will be greatly improved. By 2030, the dual control system of energy consumption will be further improved, the energy consumption intensity will continue to drop significantly, the total energy consumption will be reasonably controlled, and the energy structure will be more optimized. By 2035, the optimal allocation of energy resources and the comprehensive conservation system will be more mature and finalized, which will strongly support the realization of the goal of stable and moderate decline in carbon emissions after peaking.
4
Policy “combination punch” to promote energy supply and price stability
Since September 2021, international coal, oil and natural gas prices have risen rapidly, and many countries and regions have faced difficulties in power supply that have been rare for many years. Many provinces and municipalities in China are facing shortage of electricity, and enterprises are facing the pressure of temporary production restriction and temporary shutdown. On October 19, the National Development and Reform Commission issued a document stating that it will study the implementation of intervention measures for coal prices, marking the start of the “defense war” for energy supply and price stability. Subsequently, the National Development and Reform Commission organized a symposium on supply guarantee for key coal, electricity, oil and gas enterprises, organized trips to Hebei Qinhuangdao Port and Caofeidian Port to ensure supply and stabilize prices, investigated the cost and price of coal production and circulation, and organized a conference on rational energy use by key industrial enterprises. , study the policies and measures to stop coal enterprises from making huge profits, investigate and punish the behavior of disinformation related to coal, etc. The National Energy Administration has successively held a special meeting on the intelligent construction of coal mines, accelerating the release of advanced production capacity, and a special meeting on the supply of natural gas during the heating season. Under the control of a series of policies from the National Development and Reform Commission, the National Energy Administration and relevant departments, the national coal production has increased significantly, the spot price of coal has dropped rapidly, and the level of coal storage in power plants has increased rapidly.
Original link:https://www.energy-storage.com.cn/186.html


